CANADA'S PREMIER MASTERS THROWING CLUB
Connect with throwers aged 35 to 85+ and compete in exciting events!
★★★★★
Welcome to The Throwers Club
Join our vibrant community of masters throwers aged 35 to 85+ young! Established in 1962, the Throwers Club is the premier masters throwing club in Canada. We organize regular throwing competitions with all single events as well as triathlon & throws pentathlon. We also partner with OMA to hosts events such as the Ultra Weight Pentathlon at the Ontario Throws Festival. Newcomers are most welcome. Don't worry if it has been years since you held a shot or discus or you've never tried throwing. Come join us! You are never too old to start!
64th Year!
Of welcoming master throwers.
New Website Launched – More Updates/Enhancements Coming!
Updates 2026 Season
2026 MEMBERSHIP JOIN NOW!
2026 THROWS SUMMITS
5TH ANNUAL IN 5 CITIES
Toronto April 11 & 12th DONE
Windsor April 18th DONE
London April 25th DONE
Belleville May 2nd DONE
Sudbury May 9th DONE
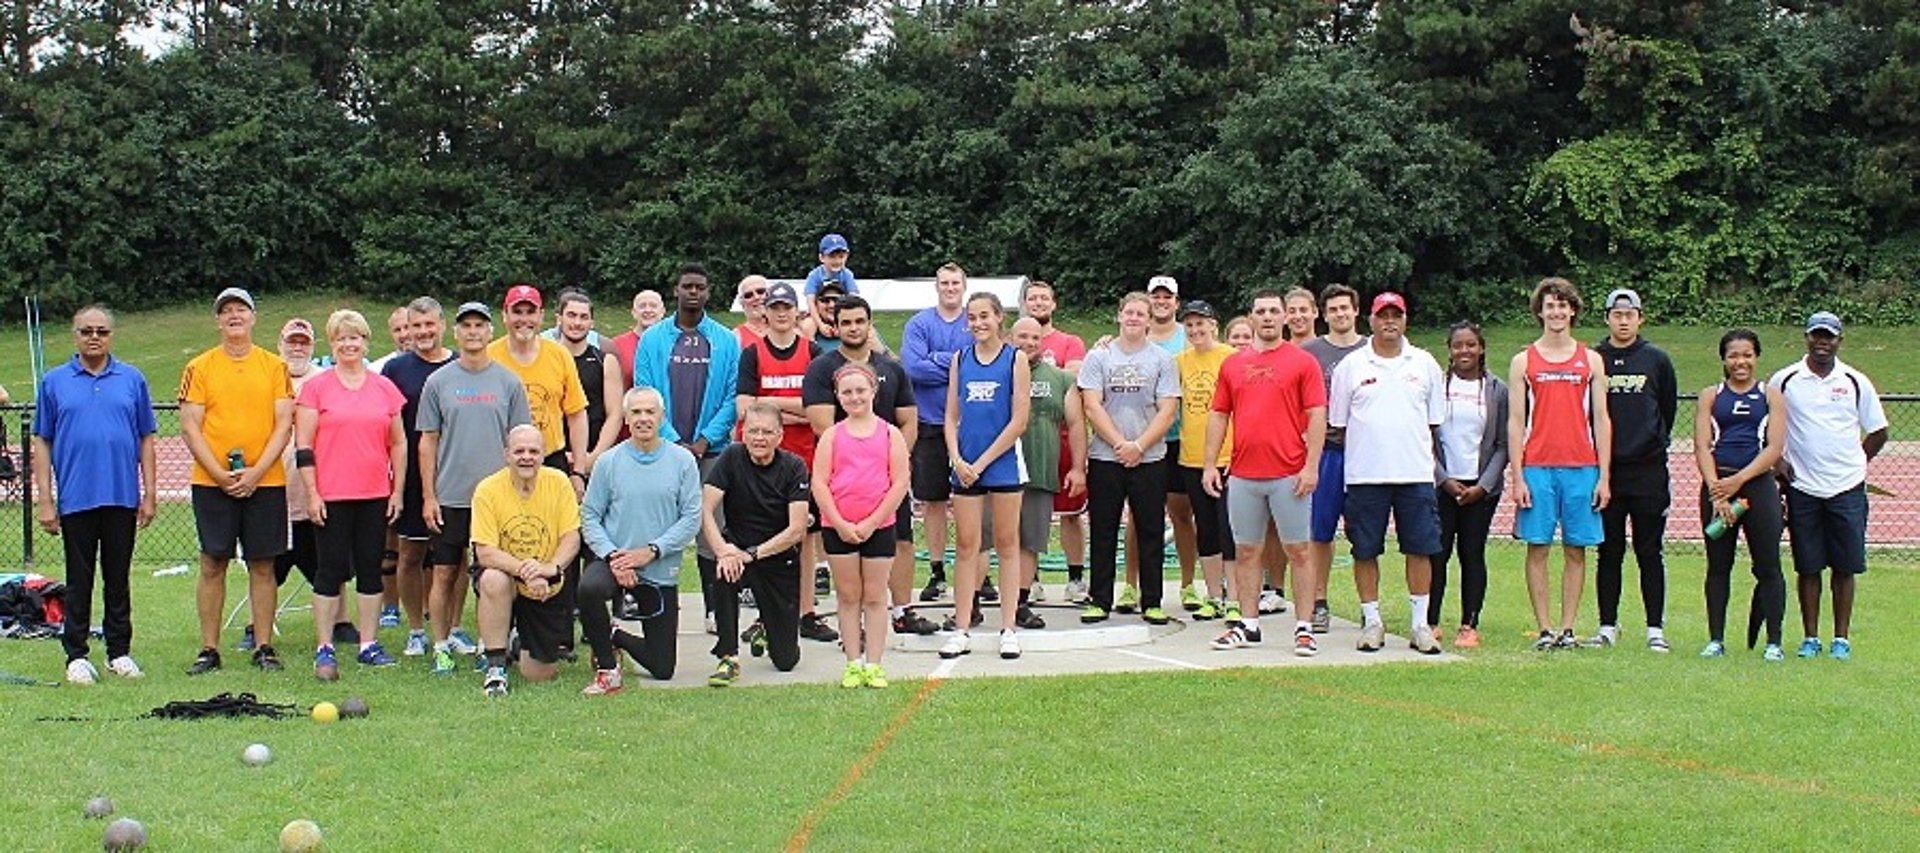
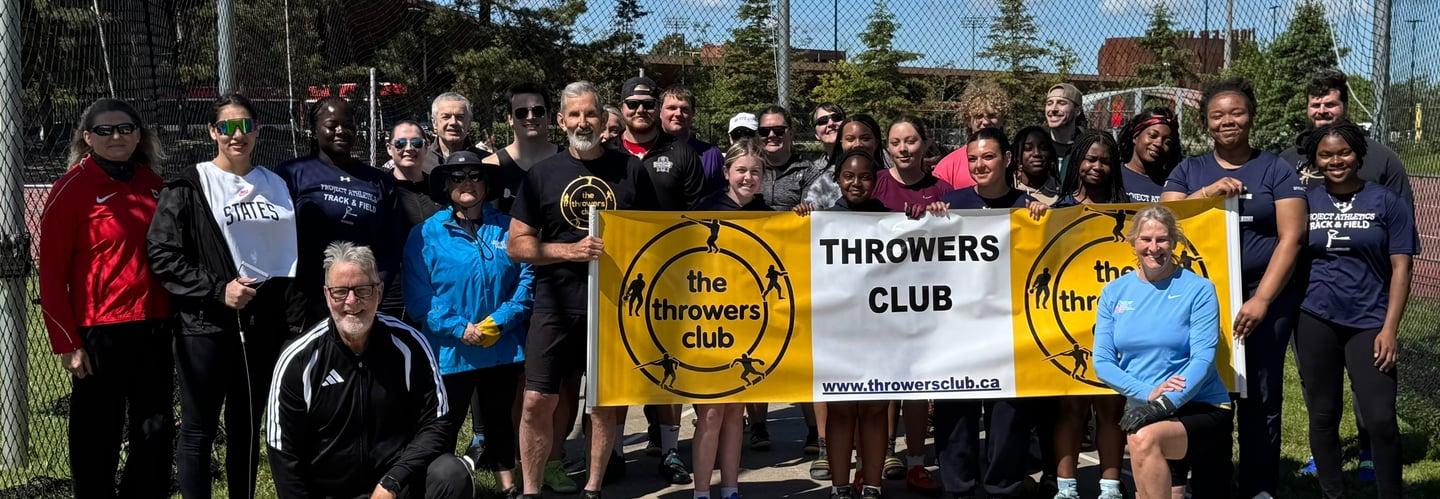
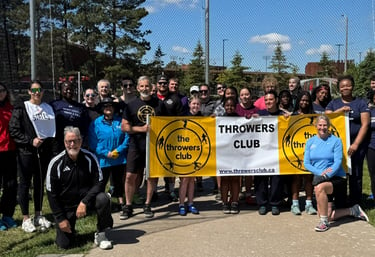
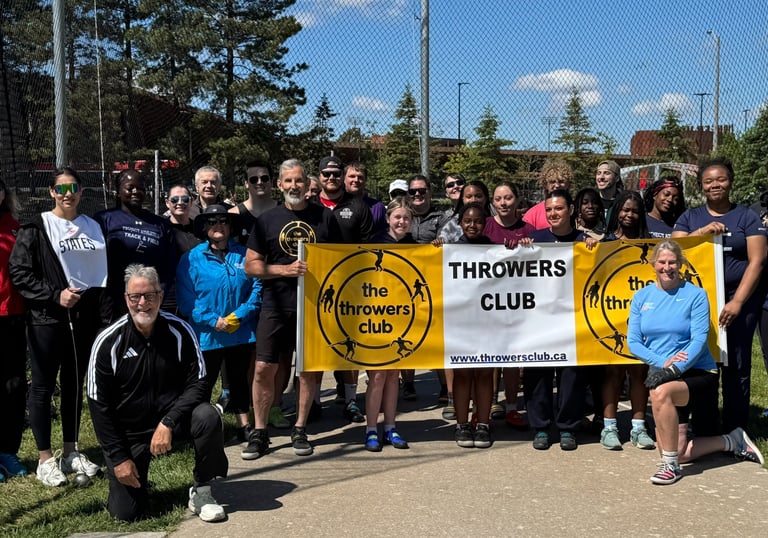
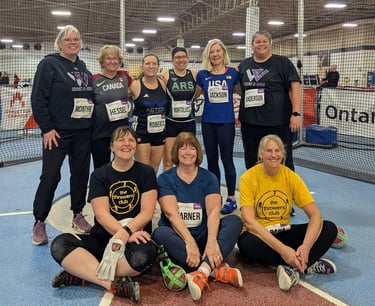
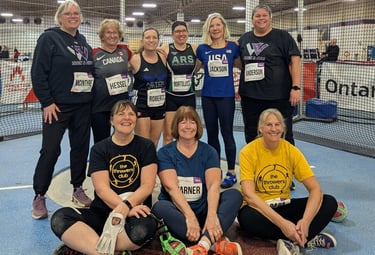
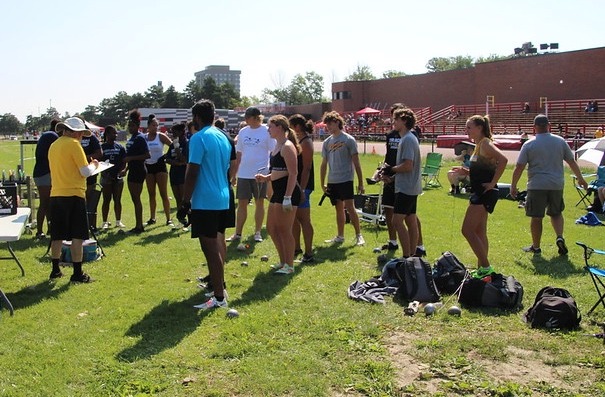
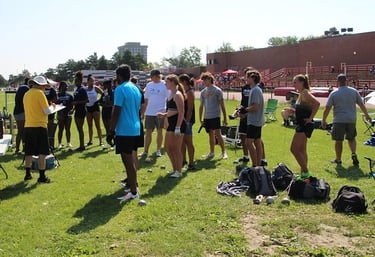
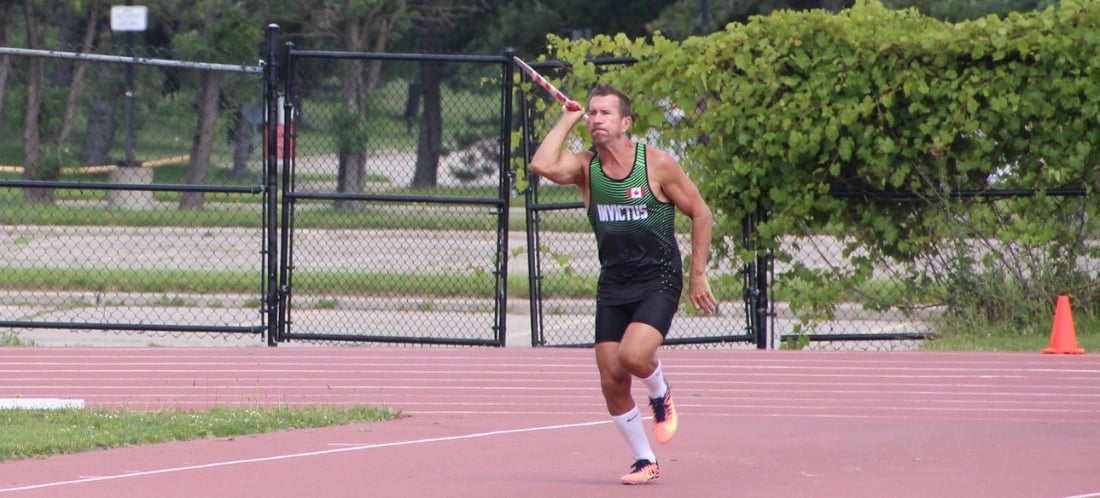
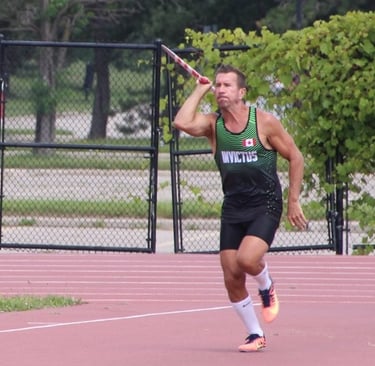
Throwing Gallery
Explore our vibrant community of throwers in action.
Contact Us
Reach out to The Throwers Club for inquiries about joining our throwing community today!